The Main > Servers page appears, displaying all servers.
The Status column displays the current status of each server (Connected / Not Connected).
The Status tab appears.
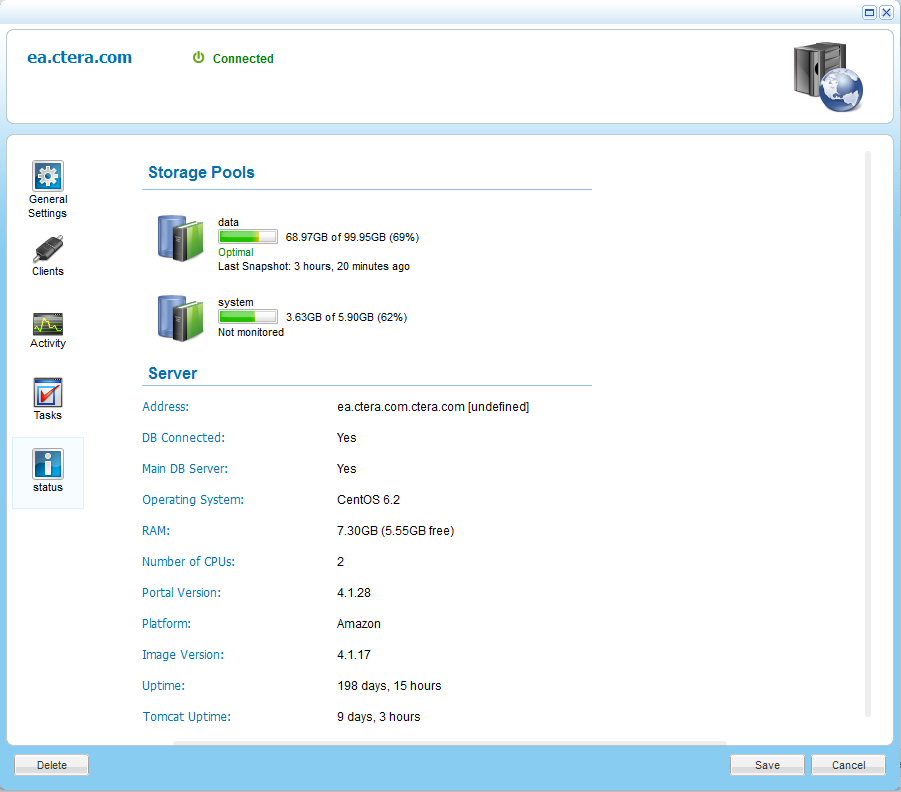
For information on the Status tab fields, see the following table.
You can view the current status of servers.
This task can be performed in the Global Administration View only.
To view servers' statuses
The Main > Servers page appears, displaying all servers.
The Status column displays the current status of each server (Connected / Not Connected).
The Status tab appears.
For information on the Status tab fields, see the following table.
In this field... |
Do this... |
Storage Pools |
The status and amount of free storage on each server storage pool. This field appears only if the CTERA Portal is installed on the OpenSolaris platform. |
Address |
The server's domain name followed by its IP address. |
DB Connected |
States whether the DB is connected to the CTERA Portal application. |
Main DB Server |
States whether the server is the main DB server of the CTERA Portal installation. |
Operating System |
The server's operating system. |
RAM |
The server's RAM followed by the amount of free space. |
Number of CPUs |
The number of CPUs on the server. |
Portal Version |
The CTERA Portal version installed on the server. |
Platform |
The platform on which the CTERA Portal is installed. |
Image Version |
The version number of the server image. |
Uptime |
The number of days and hours that the server has been up. |
Tomcat Uptime |
The number of days and hours that the application server (Tomcat) has been up. |
See Also |