The Activity tab appears.
For information on the charts displayed, see the following table.
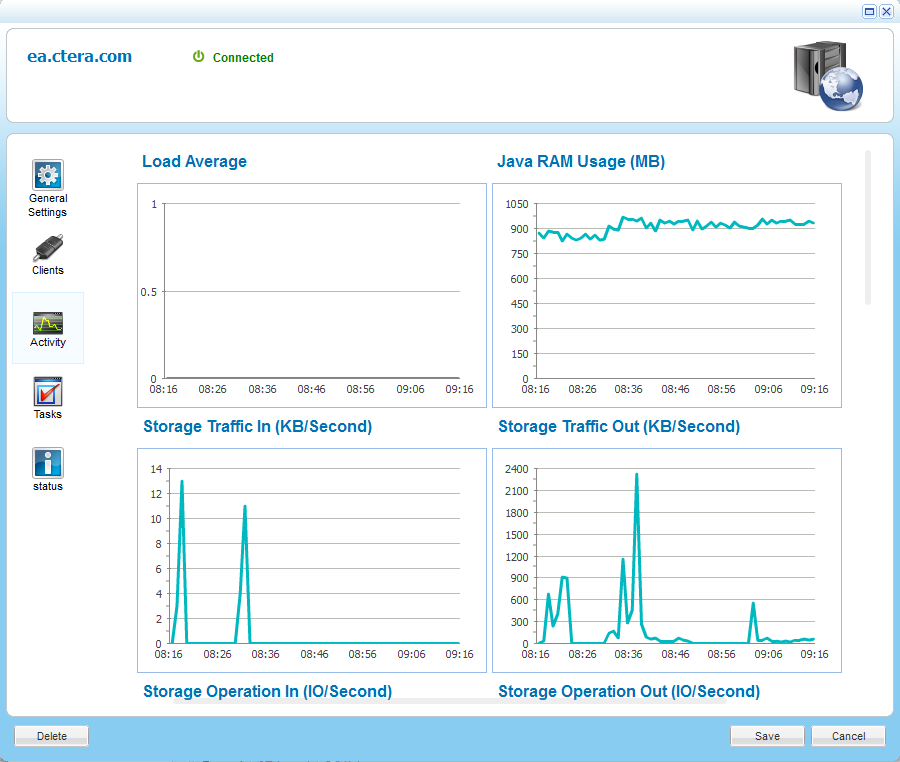
You can view charts displaying a server's activity data.
This task can be performed in the Global Administration View only.
To view a server's activity
The Activity tab appears.
For information on the charts displayed, see the following table.
This chart... |
Displays... |
Load Average |
The server's average load over time. A server's load is the number of currently running processes that are using, or waiting to use, the CPU. |
Java RAM Usage (MB) |
The server's Java RAM usage in MB over time. |
Storage Traffic In (KB/Second) |
The incoming storage traffic in KB/second over time. |
Storage Traffic Out (KB/Second) |
The outgoing storage traffic in KB/second over time. |
Storage Operation In (IO/Second) |
The number of read operations performed by the CTERA Portal on cloud storage nodes. |
Storage Operation Out (IO/Second) |
The number of store operations performed by the CTERA Portal on cloud storage nodes. |
CTTP Traffic In (KB/Second) |
The incoming CTTP traffic in KB/second over time. |
CTTP Traffic Out (KB/Second) |
The outgoing CTTP traffic in KB/second over time. |
Blocks Reclaimed (Blocks/Second) |
The number of blocks deleted per second, as part of system maintenance. |
Blocks Verification Counter (OPP/Minute) |
The number of block verifications per minute. Block verifications are executed when the portal is executing a consistency check as part of system maintenance. |
Open Database Connections |
The number of open database connections over time. |
Logged In Users |
The number of CTERA Portal administrators logged in over time. |
Connected Devices |
The number of connected client devices over time. |
See Also |