The Dashboard
The dashboard displays an overview of the CTERA Portal.
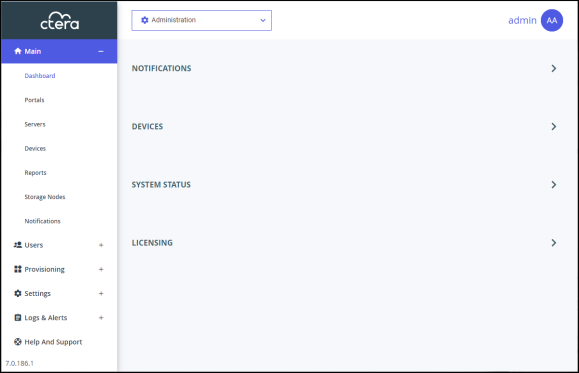
Viewing Notifications in the Main Dashboard
The dashboard displays a summary of the ten highest priority active notifications.
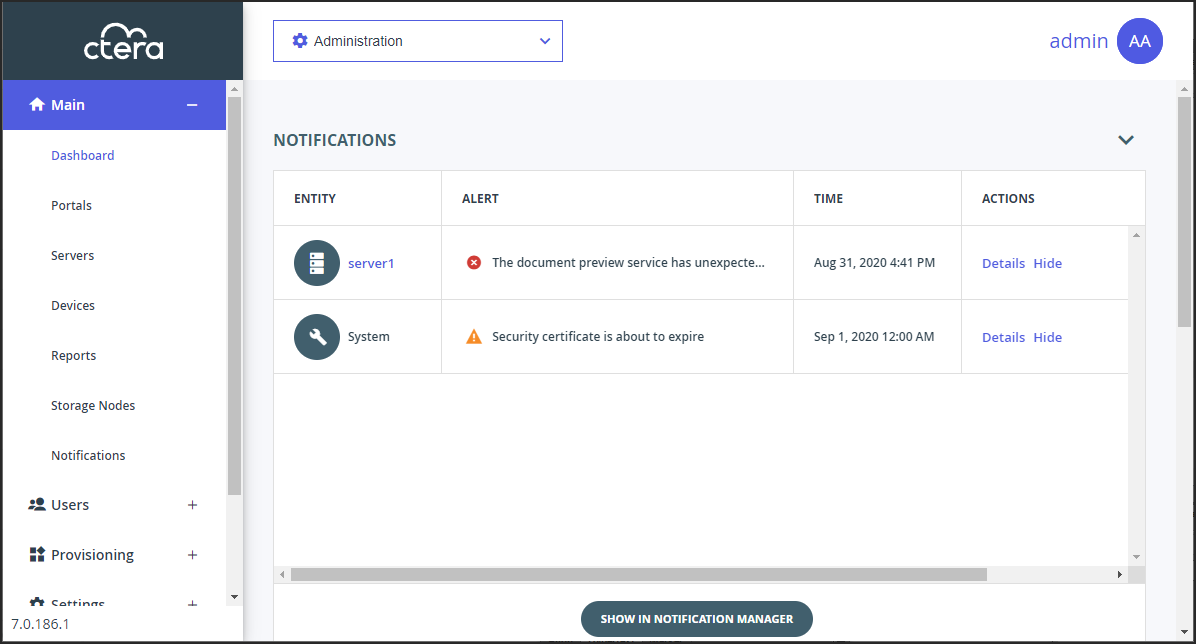
If there are notifications you can go directly to the NOTIFICATIONS page by clicking SHOW IN NOTIFICATION MANAGER. For more details about notifications, see Managing Portal Notifications and Email Templates.
Viewing Devices in the Main Dashboard
The dashboard displays a summary of devices registered with the portal. The information includes the total number of devices and the actual number connected at that time. A pie chart shows the different types of devices, such as workstation and server agents, and different licensed gateways with the licenses (EV16, EV32, etc.).
You can go directly to the DEVICES page by clicking SHOW ALL DEVICES. For more details about notifications, see Managing Devices.
Viewing the System Status in the Main Dashboard
The dashboard displays a summary of the system over time, including the cloud storage limit and actual use, the number of users and how many new users for that day as well as details of the licenses usage.
Viewing Licensing in the Main Dashboard
The dashboard displays a summary of the each license limit, the licenses provisioned, the provisioned licenses used, and the remaining license available from the provisioned licenses.