Viewing the Status Dashboard
The gateway dashboard provides an overview of the gateway's current status, including the following:
Note: In addition, the dashboard provides shortcuts to configuring arrays, drives, and volumes.
To view the Status Dashboard:
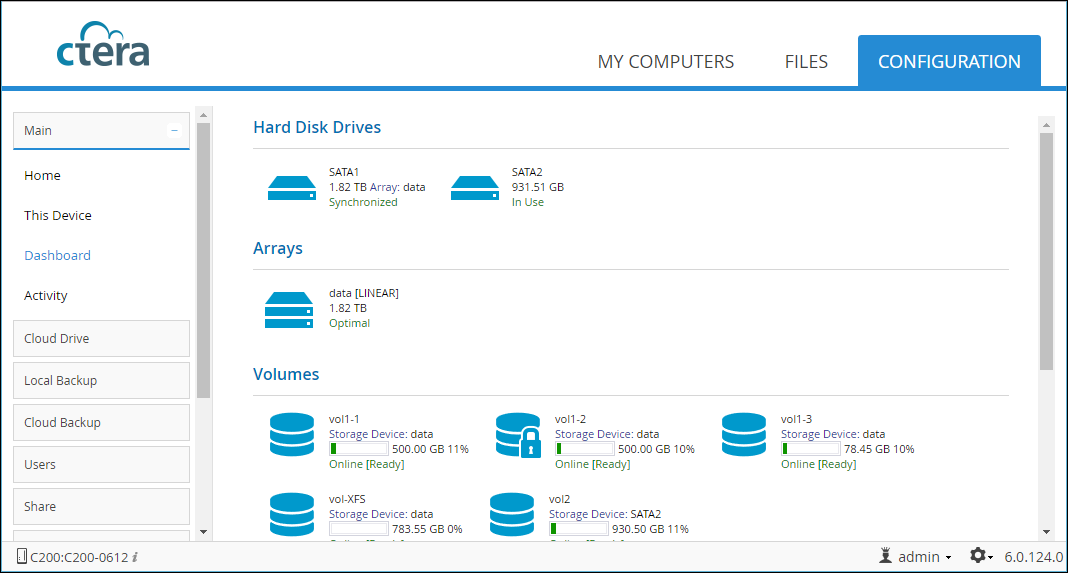
The dashboard displays the following information:
Hard Disk Drives – All disk drives installed on the gateway. For each drive:
Synchronized – This drive is in an array and is in optimal condition.
OK – The drive is not in an array and is in optimal condition.
FAIL – The drive has failed.
Unrecognized – The drive contains unrecognized data. You must format the drive before it can be used.
Inactive – This drive is in an array, but is currently not in use.
Rebuilding – This drive is in an array that is currently being rebuilt.
In Use – The drive is currently in use.
Arrays – All arrays defined on the gateway. For each array:
Optimal – The array is in optimal condition.
Degraded – When the array type is RAID1 (Mirroring), the array is accessible and there is no data loss; however, a disk is failed or missing. Performance and reliability may be reduced. Replace the failed drive as soon as possible.
Fail – The array is not accessible.
Recovering – A degraded array is being repaired. The gateway is currently synchronizing out-of-sync members of the array, and performance of the gateway may be reduced. Once the recovery is finished, the array will return to optimal state.
Scrubbing – Data scrubbing is in progress.
Volumes – All volumes defined on the gateway. For each volume:
Key required – The volume is encrypted and requires a key.
Contains errors – The file system needs to be repaired.
Read only – The file system is incompatible with current firmware.
Corrupted – Failed to read the file system status.
Unknown – No file system was found in the volume.
Ready – The volume is ready for use.
Recovering – The file system is being recovered after a non-clean shutdown.
Mounting – Routine cleanup is being performed after a non-clean shutdown.
Formatting – The volume is being formatted.
Converting – The volume is being converted (from EXT3 to NEXT3, or the opposite).
Resizing – The volume is being resized.
Repairing – The volume is being repaired.
Checking – The volume is being scanned for errors.
Checking Quota – The volume's storage quotas are being recalculated.
System Information
Last Events – The last few important events in the gateway Event Log. For information on log fields, see the CTERA Edge Filer Administration Guide.
Note: The data is refreshed automatically every few seconds.